User-generated content (UGC) is shaking up how brands connect with audiences, putting authentic, relatable content within reach — without the hefty price tag of traditional marketing campaigns.
For creators, UGC has opened up a new way to make money, even without a big following.
Whether you’re a creator looking to break into this growing market or a brand ready to make the most of the UGC boom, we’ve got the data to steer you in the right direction.
Read on as we unpack over 100 UGC statistics from growth to benefits, and more.
UGC market statistics
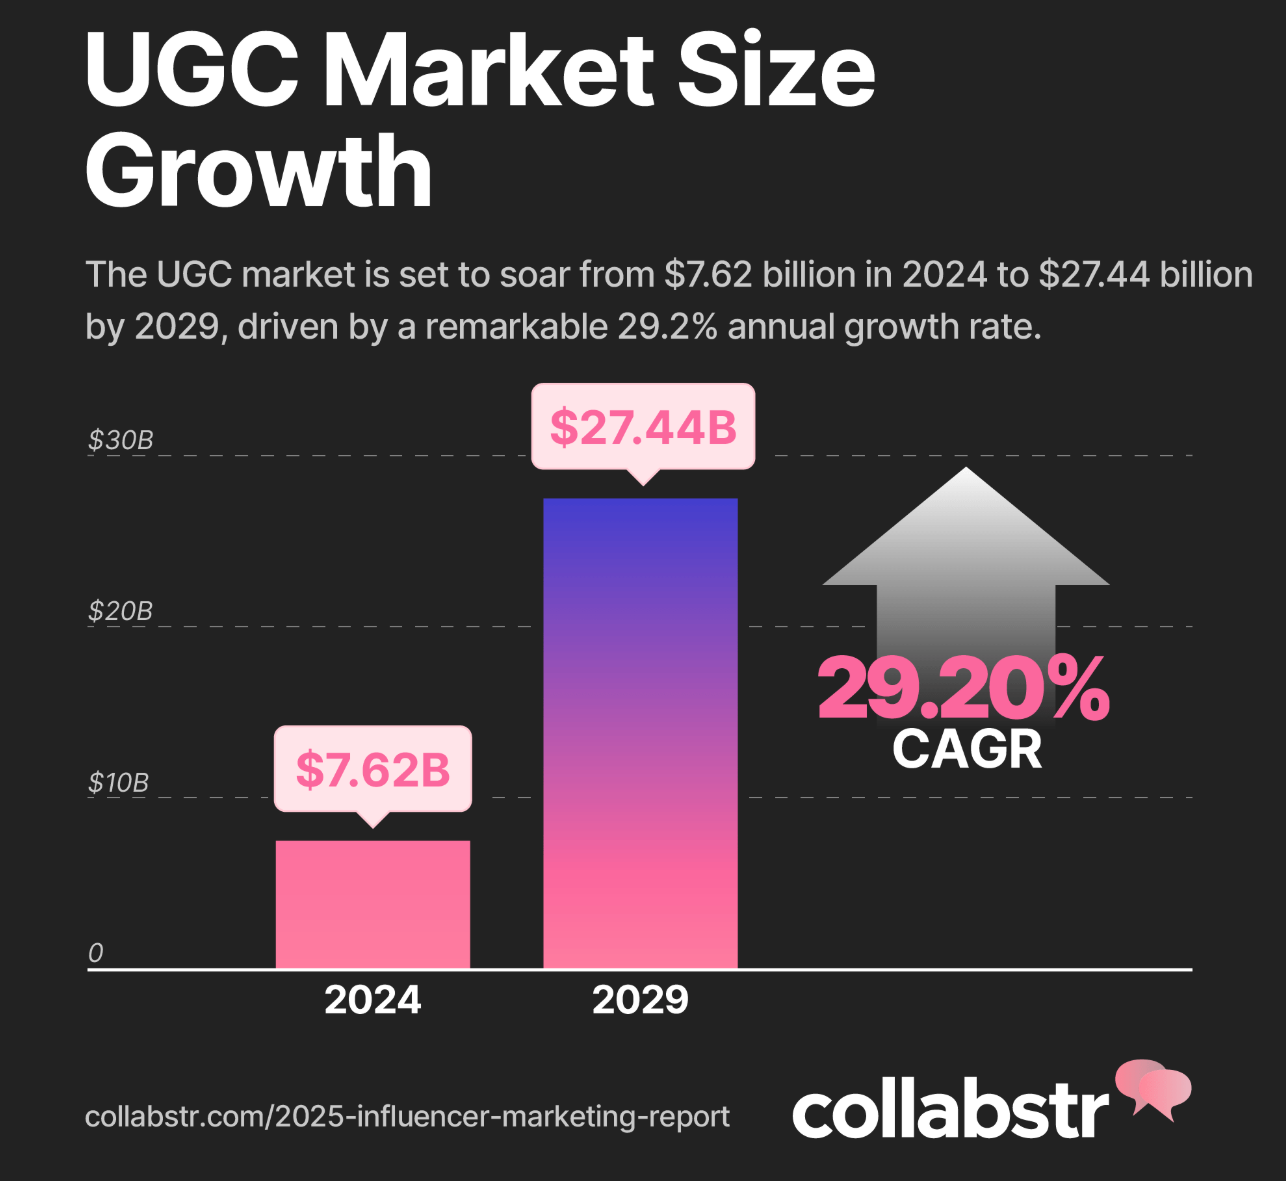
As of 2025, the UGC market was worth over $7.6 billion, up 69% from $4.5 billion in 20241. Key factors driving this upward trend included:
- Tighter marketing budgets pushing brands toward more affordable marketing strategies like UGC.
- Consumers’ growing preference for more authentic, relatable content.
- The shift towards building trust and genuine connections with customers.
Driven by a compound annual growth rate (CAGR) of 29%, the UGC market is expected to surpass $27 billion by 2029.
By 2033, experts predict that 78% of all online content will be user-generated2.
UGC falls within the $24 billion influencer marketing industry and the broader creator economy, estimated to be worth a whopping $480 billion by 20273.
At least 88 UGC platforms were available on the market as of 20254. The global UGC software platform market, which includes players like Tint and Upfluence, is expected to grow at a CAGR of 32%, reaching $71.3 billion by 20325.
In the US alone, spending on UGC content is expected to exceed $10 billion in 2025, up 11% from $9 billion in 20246.
Overall, since 2021, spending on UGC has grown by 100%.
Average UGC rates ranged between $150 and $212 in 20247.
UGC usage rights cost 30%-50% of the base rate, while raw footage cost an additional 40% of the base rate.
On some of the most popular UGC marketplaces such as
- UGC Shop: an image was $150-$200, and a TikTok reel was $3008.
- Billo: 6 UGC videos cost $500, 14 videos cost $1,000, and 37 videos cost $2,500.
- Influence: UGC videos cost $36 per video with a $300-$700 per month subscription.
- UGC planet: UGC videos cost $100-200 per video.
- Collabstr: UGC videos cost $50-$1000 per video.
- Vidovo: UGC videos cost $150-$200 per video, with a subscription fee depending on the creator.
Pricing also varied according to experience levels. While beginner UGC was priced at $50-100 per video, this went up to $150-$500 per video for mid-level creators.
Pricing for established creators increased to $500+ per video.
Platform and format also affected UGC pricing. Images typically cost $25-200, and tweets on Twitter (X) cost $25-$200+.
Meanwhile, UCG videos on:
- Instagram cost $50-$500+ per video
- TikTok cost $25-$250+ per video
- YouTube cost $100-$1,000+ per video
Generally, creator follower counts also impacted the costs of UGC.
- 0- 1k followers - $155
- 1k- 10k followers - $178
- 10k - 100k followers - $248
- 100k+ followers - $558
On average, brands spent over $70,000 on professional content creation in 20249.
Overall, UGC reduced content creation costs by up to 30%.
UGC creator statistics
Between 2024 and 2025, the number of UGC creators increased by 93%10.
UGC market share also increased, with 15% of collaborations on social media being UGC campaigns.
Between 2020 and 2025, interest in becoming a UGC creator skyrocketed by over 8,700%.
Similarly, interest in UGC increased by 564%, while interest in UGC marketing increased by 275%.
A 2023 study of over 1,000 UGC creators found that female creators dominated the space at 96%.
Most creators (51%) were between the ages of 25-34, while 37% were 18-24 and 9% fell within the 35-44 age range.
The same study found that TikTok was the most popular social media platform, with 54% of UGC creators using it as their main platform.
At 42%, Instagram was next. Over 67% of creators posted UGC on their own accounts, while 13% did not.

Instagram was used by almost 100% of UGC creators in some way. TikTok followed closely behind with a 97% usage rate.
X/Twitter (48%) and YouTube (43%) were less popular among UGC creators.
In 2024, the average UGC creator had:
- 10.5k followers on Instagram
- 20.2k followers on TikTok
- 1k on X (formerly Twitter)
- 1.5k on YouTube
Before going into UGC, 67% of creators made content on Instagram and
60% made content on TikTok.
Only 4% of UGC creators were completely new to social media content creation before diving into UGC.
- 22% made content on YouTube
- 20% made content on Facebook
- 8% had a blog
36% of UGC creators cited TikTok as the main reason they started doing UGC.
21% were inspired by Instagram. Only a small percentage (4%) was influenced by YouTube.
The report also highlighted that the UGC industry was still in its early stages. Most creators (59%) had done UGC for under a year.
21% had been in UGC for 1-2 years, 12% for 2-3 years, and only 4% for over 4 years.

When asked how many brands they had worked with, 67% of creators said over 6 brands.
Meanwhile:
- 10% worked with 1 brand
- 8% worked with 2 brands
- 6% worked with 3 brands
- 5% worked with 4 brands
- 3% worked with 5 brands
UCG creators with 1-2 years of experience made the most content (71 posts) per month.
UCG creators with 3-4 years of experience made around 12 posts per month, while those with over 4 years of experience posted the least amount of content every month (less than 10 posts)
62% of UGC creators worked on UGC part-time.
Only 38% worked on UGC full time and considered it their main or only source of income.
Creators who worked on UGC full-time made an average of 62 posts per month, and a median of 10 posts per month.
They also spent around 21-40 hours per week on content creation.
Those who worked on UGC part-time made an average of 14 posts per month, and a median of 5 posts per month.
These creators spent 6-10 hours per week working on content.

UGC creators earned a combined average of $3.8 million in 2023.
They made an average of $12,500 and a median of $1,500, yearly.
60% of creators first got paid for creating UGC between 2021 and 2023, reflecting the industry’s newness.
On average, it took less than 1 year for UGC creators to get paid for content.
76% of creators received gifts instead of money when they first started. Beyond year 4 of creating, gift payments dropped to 2.4%.
Creators who accepted gifts had an average follower count of 6,100 for TikTok and 5,200 for Instagram.
Asked about the best part of being a UGC creator, 33% of creators said they enjoyed making content the most.
25% mentioned not needing a big social following and being able to be independent. Meanwhile:
- 10% of UGC said making money
- 6% said being creative
- 4% said receiving products
66% of UGC creators believed brands chose them over influencers and other traditional marketing strategies because UGC increases brand authenticity.
13% believed UGC’s lower costs and higher conversion rates were key factors.
When asked how they thought they were different from influencers, 30% of UGC creators said they were more authentic.
25% said, unlike influencers, they didn’t need a massive following to land brand deals or be successful. Other differences included:
- Having the freedom to be more creative - 7%
- Being able to relate to audiences more effectively - 6%
- Being able to deliver more conversions - 5%
As for the future of UGC, 60% of UGC creators believed the industry would continue to grow.
Over 10% believed the industry would become saturated, forcing creators to be very skilled to succeed.
66% of creators offered UGC services to brands as of 2025.
This is up a notable 40% from just 26% in 2024. On average, UGC creators monetized 2 social media accounts.
At 14%, most UCG creators targeted the Food & Beverage and the Sports & Leisure industries in 2024.
Music (13%) and Travel (11%) followed closely behind. Meanwhile, Pets and Real Estate were the least popular industries at 6% and 3% respectively.
The most popular video styles uploaded by UGC creators in 2024 were music-based and positive brand feedback at 14%.
This was followed by food and recipes (13%) and reviews (12%).

Capcut and Canva were the most important video-making tools in 2024, according to nearly 50% of UGC creators.
Other top video-making tools included:
- Adobe Premiere Pro - 17%
- Photoshop - 11%
- iMovie - 11%
In 2024, UCG creators uploaded their videos to Instagram (27%) and Facebook (27%) most often.
YouTube was next at 26%, followed by TikTok at 19%.
YouTube was the most consistently favored social platform across UGC creators of all ages.
Breaking it down by age group, creators aged:
- 18-24 picked TikTok as their favorite platform.
- 25-34 picked Instagram as their favorite platform.
- 35-44 picked Facebook as their favorite platform.
- 45-54 picked YouTube as their favorite platform.
- 55-64 picked Facebook as their favorite platform.
- 65+ picked Facebook as their favorite platform.
At 21%, product seeding or providing free product was the top way UGC creators were drawn to work with a brand in 2024.
Other ways included:
- Being approached for a brand collaboration or paid sponsorship - 19%
- Believing that a brand provided a great product or service - 18%
- Being included in giveaways or contests - 16%
On average, UGC creators charged around $198 for content in 2025.
This was:
- 71% lower than YouTube influencers.
- 46% lower than Instagram influencers.
- 43% lower than TikTok influencers.
It was also 44% lower than what UGC creators charged in 2024, making this the steepest decline in pricing in recent years.
UGC marketing stats
As of 2025, 93% of marketers who used UGC said it outperformed traditional branded content.
On average, brands spent $178 per UGC creator, making UGC:
- 80% cheaper than influencer marketing on YouTube.
- 54% cheaper than influencer marketing on Instagram.
- 53% cheaper than influencer marketing on TikTok.
Over 65% of marketers said UGC, particularly user-generated video, was important to their overall marketing strategy in 2024.
The main reason they used user-generated video was brand awareness (50%) as well as driving leads and sales (38%).
In a 2023 study, 92% of marketers agreed consumers' purchase decisions were influenced more by UGC than they were five years ago12.
- 93% believed running visual UGC campaigns was a good way to generate and repurpose more content.
- 85% agreed using UGC was cheaper than professional branded content or influencers
- 87% also agreed launching and scaling UGC campaigns was easier
Most marketers (26%) relied on user-generated video product reviews to drive engagement in 2024.
Next: videos providing positive brand feedback (19%) and instructional content or tutorials.
71% said user-generated video was valuable for generating and nurturing leads.
65% also stated social media campaigns involving UGC performed better. A further 46% said it was more valuable than paid influencer content.
Brands using UGC saw 28% higher engagement rates.
Visual UGC, such as videos and photos, saw higher engagement rates of up to 50%.

Most marketers (43%) selected Facebook as the top platform for generating sales via user-generated video.
At 16%, both YouTube and Instagram were the next sales drivers. Meanwhile, for building awareness via user-generated video, over 32% of marketers selected YouTube as the top platform.
33% of marketers selected UGC as the visual content that generated the most customer trust, placing it ahead of:
- Professionally shot videos or images - 24%
- Influencer-generated videos or images - 18%
- AI-generated videos or images - 16%
- Stock videos or photos - 8%
For 62% of marketers, video UGC had the most impact on their audience, followed by images (24%).
36% of marketers had only leveraged UGC for 1-2 years, while 24% had only leveraged it for 2-5 years.
In 2024, 87% of all search engine results considered UGC the second most influential purchase driver13.
Additionally:
- UGC based ads received 4x higher click-through rates versus traditional ads.
- Websites featuring UGC saw a 90% increase in time spent on site.
- UGC on product pages increased conversion rates by up to 200%.
There was a 104% lift in conversion when website visitors interacted with UGC in 202414.
This is up from a conversion lift of 101% in 2021.
UGC trust statistics
As of 2025, 60% of consumers felt that UGC was more authentic than any other form of marketing.
They also found it 9.8 times more effective than influencer content. 72% said they were more likely to follow a company that used UGC, while 61% said UGC encouraged them to engage with brands.
Another study revealed that in 2023, 90% of consumers preferred to see UGC, up 5% year over year15.
Additionally, 86% of consumers trusted brands that used UGC over influencer marketing. They were also 2.4x more likely to rate brands as more authentic for doing so.

In 2024, consumer trust levels in UGC increased around the world. Notably, trust in UGC was highest in India at 93%16.
Trust levels in other countries were as follows:
- US - 65%
- UK - 57%
- France - 62%
- Germany - 56%
- Canada - 64%
- Australia - 59%
Over 77% of Millennials felt UGC was more trustworthy and valuable than brand, retailer, or influencer content.
Millennials were most likely to feel this way, followed by over 74% of Gen Z consumers.
76% of consumers considered videos as the most trustworthy form of UGC in 2024.
Images were next at 13%, followed by text (7%) and audio (3%). Additionally, close to 50% considered brands that used user-generated video more trustworthy than those that didn’t.
UGC effectiveness statistics
90% of consumers considered UGC the most influential purchase driver in 2024.
- 73% of consumers said UGC increased their purchasing confidence.
- 83% were also more likely to purchase from brands using UGC.
- 70% of consumers were open to spending more money on brands they deemed authentic and trustworthy17.
Engaging with UGC before buying was highest (97%) in consumers aged 18-2418.
This was followed by consumers aged 25-34 (94%) and those aged 35-44 (91%). The need to consult UGC was lowest among customers over 65.
In 2024, 85% of consumers relied on user-generated video before making a purchase.
81% agreed that user-generated video was more influential than brand or influencer content. Additionally:
- 72% admitted they were more likely to buy if a company used UGC.
- 67% stated UGC (ratings, reviews, photos, and videos) persuaded them to make a purchase they weren’t initially planning19.
- 25% would actually leave a product page if it lacked UGC like photos or videos.

A 2024 study found that 89% of consumers valued UGC as it allowed them to see what a product looked like in real life20.
Other top reasons included:
- Getting a better sense of product sizing - 72%
- Understanding product quality/performance - 70%
- Getting a more authentic perspective than standard brand-created imagery - 68%
Another 2024 study found that:
- 62% of consumers used UGC to determine value for money, up 4% from 202221.
- 38% of consumers used UGC to determine fit for purpose, up 1% from 2022.
- 25% of consumers used UGC to determine delivery service, up 2% from 2022.
The same study found that 91% of consumers were more likely to buy a product with user-generated photos and videos, up 85% from 2021.
Gen Z consumers were the most likely to do so at 96%, followed by Millennials (93%) and Gen X consumers (87%).
23% of consumers also said they wouldn’t purchase a product in the absence of visual UGC.
This sentiment was highest among Gen Z at 36%, as well as Millennials at 24%.

In 2024, 81% of Gen Z consumers considered UGC a necessary source of information when researching products to purchase.
Gen Z was most likely to feel this way, followed by 72% of Millennials.
Clothing (88%), Shoes (76%), and Health and Beauty (74%) were the top product categories for which consumers considered UGC important in 2024.
For women, Clothing led the charge at 90%, while Electronics was the top category for men.
When conducting research through UGC, the category consumers researched most was Electronics at 62%
Apparel was next at 46%, followed by Health and Beauty (42%), and DIY (34%).
Most consumers (84%) stated they wanted to find UGC on product pages.
Followed by:
- Product category or search pages - 54%
- Social media posts - 51%
- Website homepage - 36%
- Promo emails - 25%
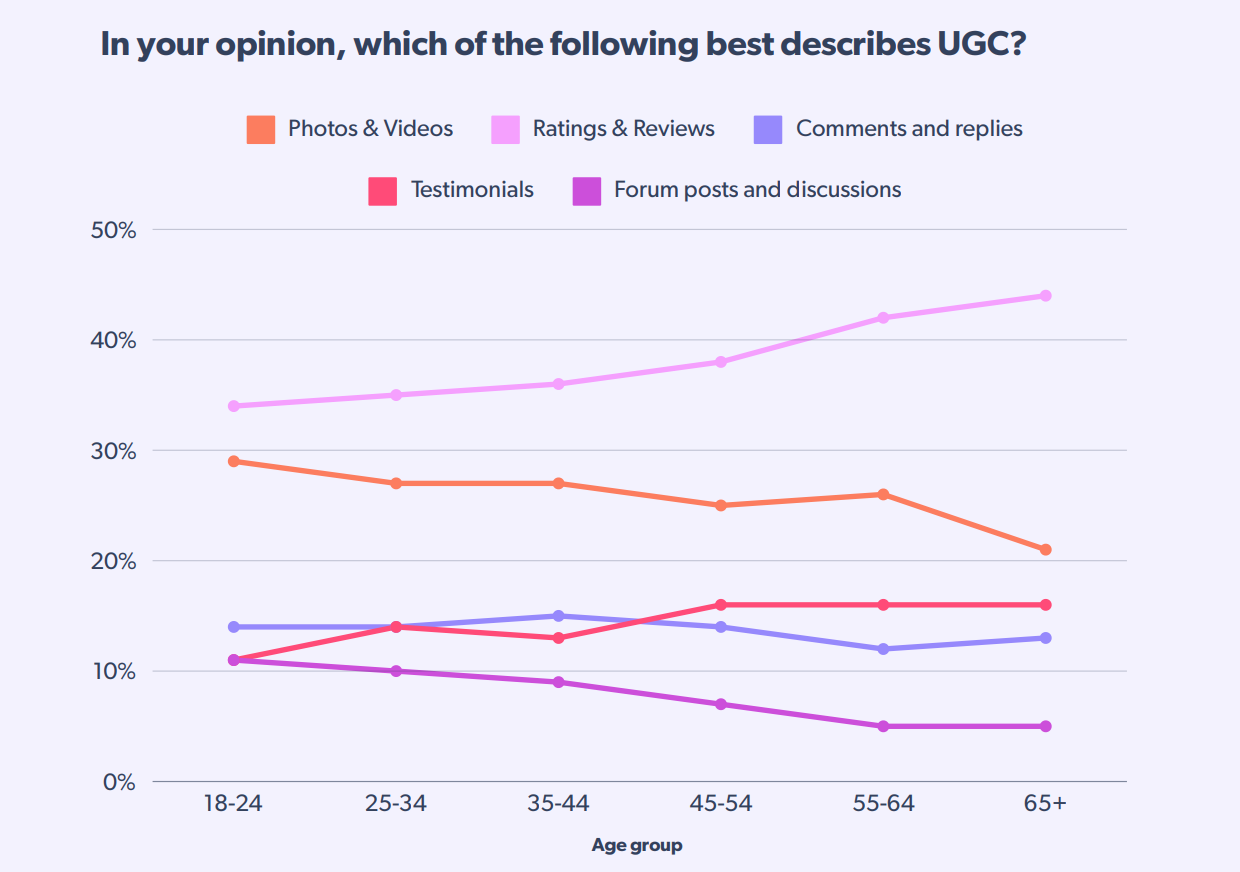
By generation, most Gen Z consumers (29%) leaned towards visual UGC or immersive content showcasing products in real-life scenarios.
This was the case for just over 25% of Millennials. In contrast, most Boomers (44%) prioritized ratings and reviews, reflecting their preference for straightforward guidance.
At 14%, user-generated review videos were the most popular among consumers.
This was followed by music-based (14%), food (13%), and life-hack (10%) user-generated videos.
UGC and social media statistics
Global social media users hit 5.24 billion in 2025, an increase of 4.1% year over year22.
2 hours and 21 minutes was the average time internet users spent on social media.
At 35%, social media apps accounted for the largest share of time spent on smartphones.
Gen Z internet users spent 54% more time on social platforms watching UGC in 202523.
This was up to 50 minutes more per day than the average consumer.
56% of brands focused exclusively on using UGC on social platforms in 2024.
Short-form videos typically had an average engagement rate of 12%24, and this
varied by industry, for example:
- Pets -17%
- Consumer Packaged Goods - 16%
- Other - 15%
- Fashion -14%
Meanwhile, short-video UGC on platforms such as TikTok, Instagram Reels, and YouTube showed up to 38% higher engagement rates across the board.
.Social media ad spend increased to $243 billion, up 15% from 2024.
There was a 14% increase in more authentic and relatable types of marketing, such as UGC and influencer marketing.

The top three social platforms that generated the best UGC were:
- Instagram - 34%
- YouTube - 23%
- TikTok - 22%
With over 32 billion monthly visits, YouTube was the most visited website hosting UGC as of March 202425.
Meanwhile, Facebook had over 16 billion monthly visits. This was followed by:
- Instagram with 7 billion monthly visits.
- Twitter with 6.1 billion monthly visits.
- Reddit with 2.2 billion monthly visits.
50% of all social media users visited social media platforms to learn more about brands.
This figure increased steadily throughout 2024 with Instagram taking the lead at 62%, followed by Facebook (53%) and TikTok (52%).
48% of consumers discovered new products through UGC on social feeds26.
- 82% of Gen Zers and 70% of millennials discovered new music or artists through UGC videos on social platforms
- A combined 75% encountered music in a UGC video and searched for the artist’s music.
UGC on YouTube
At the start of 2025, YouTube, with over 2.5 billion users, had the most active user base:
Facebook, with 3.1 billion users, had the third most active user base. This was followed by
Instagram, with 2 billion users, and TikTok, with 1.6 billion users.
96% of Gen Z watched both short and long-form videos on YouTube in 202427.
UGC content on YouTube drove 12x impressions, 17x engagements, and 10x more views compared to brand-owned content. YouTube Shorts played a big part in this trend. In the US alone, YouTube shorts engagement grew by over 25%.
YouTube generated the most UGC according to over 28% of marketers in 202428.
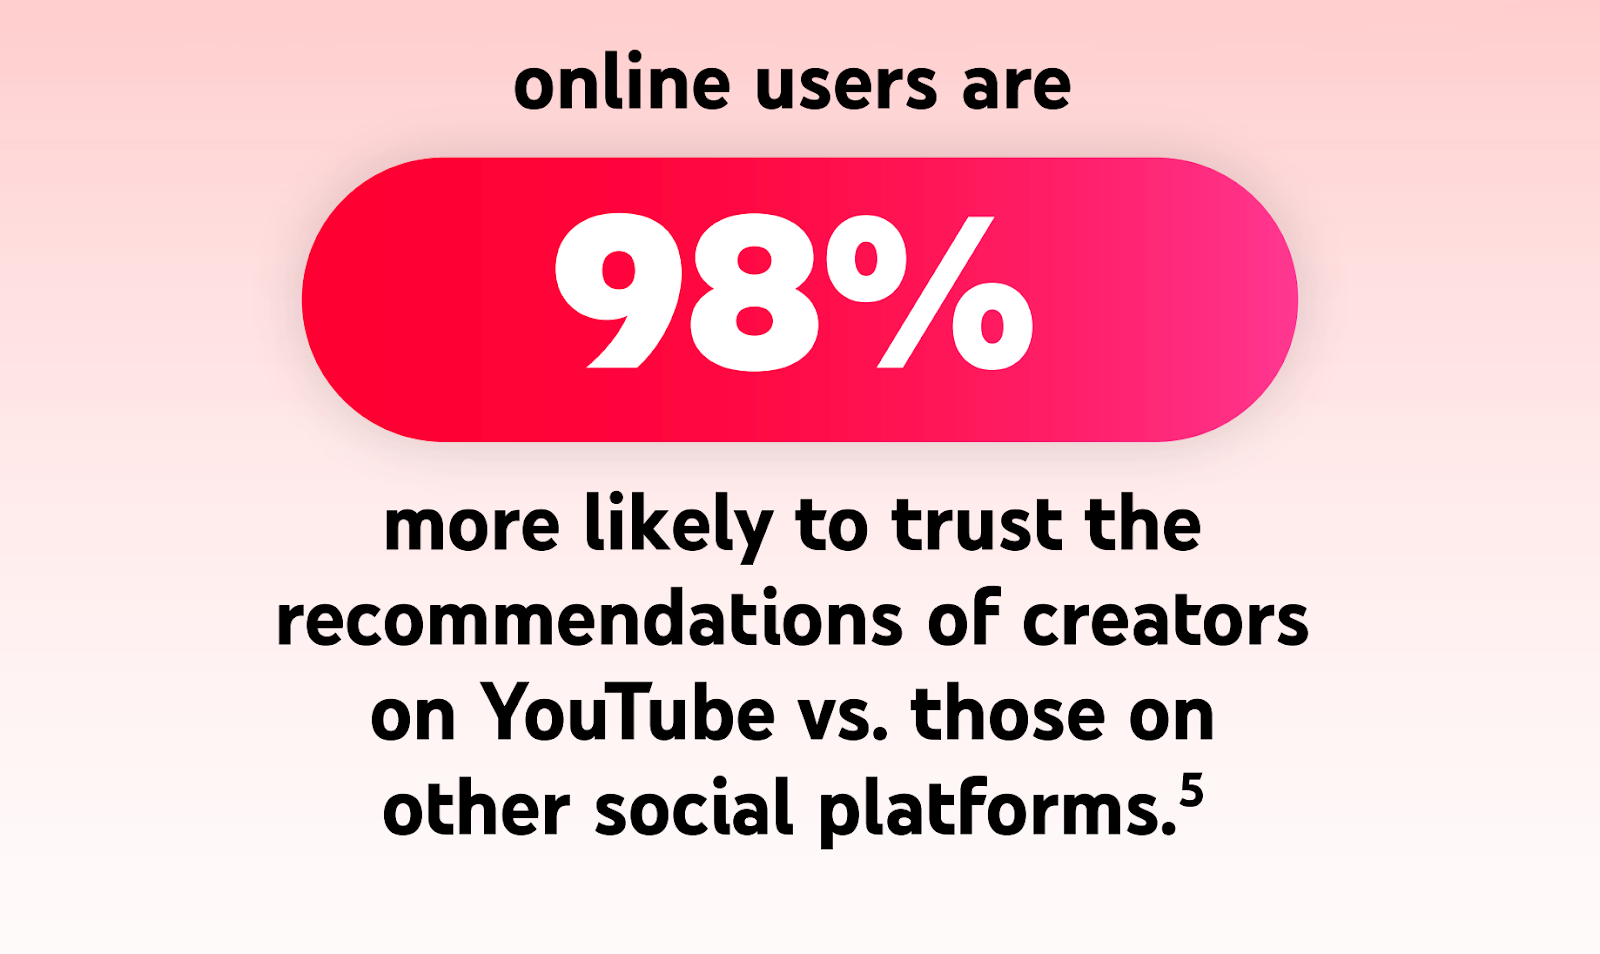
Users were 98% more likely to trust UGC creator recommendations on YouTube vs other social platforms.
65% of marketers planned to shift their focus to YouTube in 2025 and increase their budgets to focus on strategies like:
- Influencer-led marketing - 26%
- Organic content marketing - 25%
- Paid ads - 14%
- Sponsored content - 10%
UGC on TikTok
At the end of 2024, social media users spent an extra two hours on TikTok, bringing the average monthly time spent on the app to 35 hours.
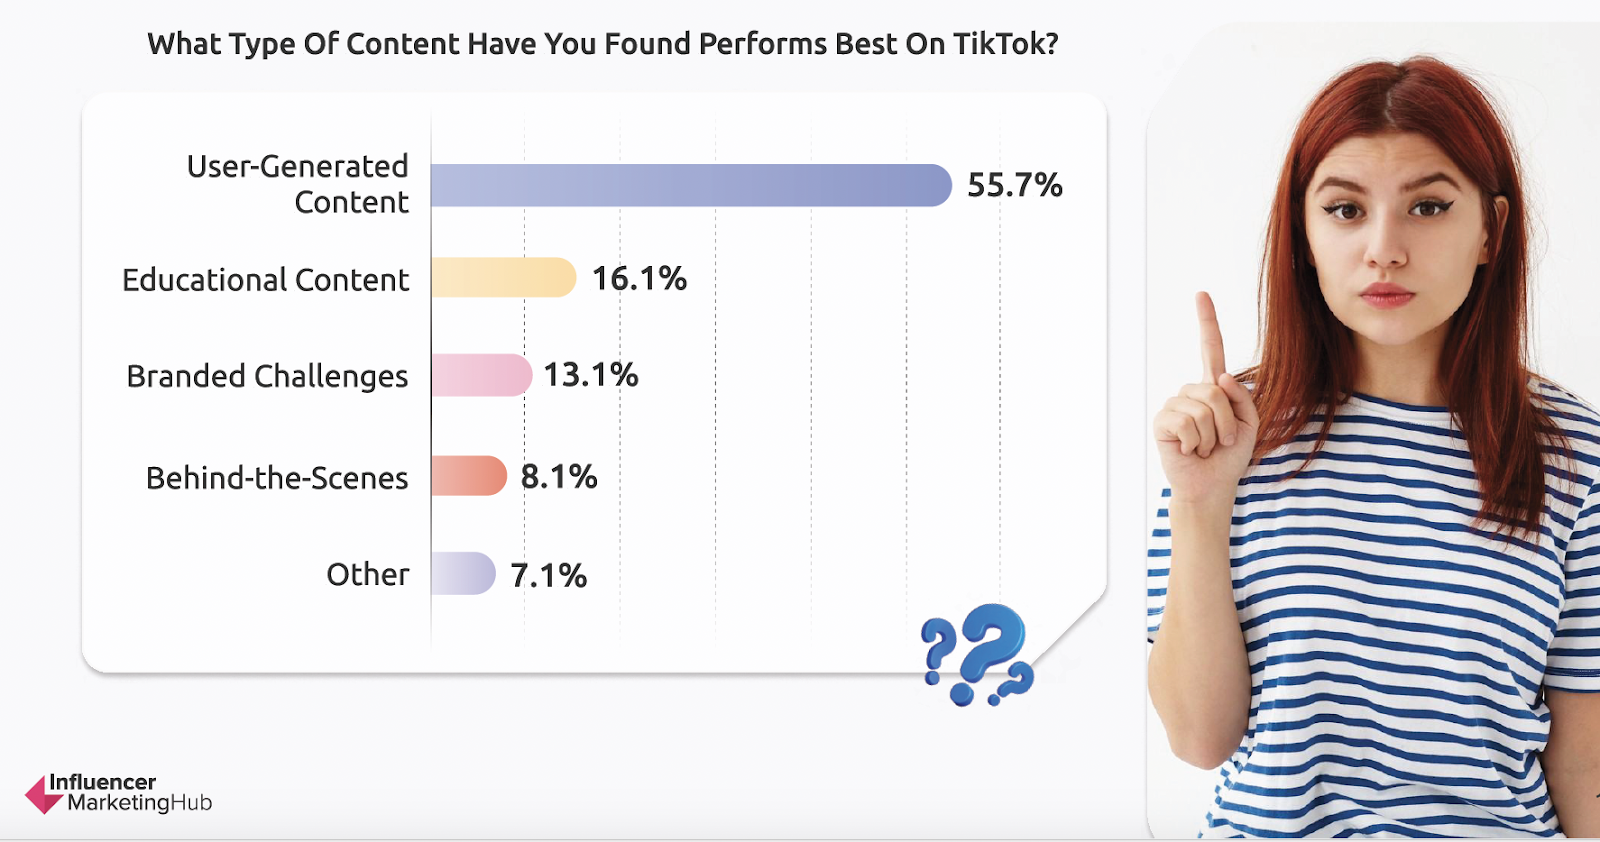
Leading at 56%, UGC was the best performing content type on TikTok. This was followed by educational content (16%) and branded challenges (13%)29.
As of 2025, 90% of social media users trusted UGC on TikTok30.
Consumers exposed to UGC on TikTok were also 97% more likely to buy.
UGC on TikTok was 22% more effective than brand-created videos31.
This surpassed the engagement rates of Facebook ads by 32% and regular ads by 46%.
UGC ads on TikTok outperformed regular ads with a 30% higher completion rate32.
They also had a CTR 1.5% higher than average, 142% more engagement, and a 43% lift in conversions.
Earlier studies revealed that UGC on TikTok helped 39% of TikTok users discover new products or brands on the platform33.
Nearly 50% of TikTok users also reported buying something on the platform because of UGC.
Close to 60% of brands focused exclusively on TikTok in 202434.
A further 51% allocated half their budgets to TikTok.
UGC on Instagram
49% of consumers used Instagram in 202435.
Reflecting its popularity among businesses, 52% of brands used the platform to generate awareness and build consumer trust.
85% of Instagram’s users were under 45 years old.
This made Instagram one of the top three social platforms for Gen Z and Millenials.
Instagram produced the highest quality UGC, according to over 32% of marketers. It was also the second most powerful platform for brand engagement after YouTube in 2024.
28% relied on UGC to drive engagement on the platform. Additionally, 20% or 1 in 5 marketers reported that they saw the highest ROI from Instagram.

17% of social media users selected Instagram as their favorite platform, placing it ahead of:
- WhatsApp - 16%
- Facebook- 13%
- TikTok - 8%
- Twitter(X) - 3%
In 2024, 25% of social media users reported buying a product directly from Instagram.
The average order value sold by creators on Instagram increased by over 87% between 2022 and 2023.
Instagram Reels outperformed single-image posts by 55% and standard videos by 29% in 2024.
Instagram reels saw a growth rate of over 8%, making them the format of choice for UGC creators on the platform. At 6%, photo posts saw the greatest decline in use.
UGC challenges statistics
Asked about the hardest part of being a UGC creator in 2024, 60% of creators said reaching out to brands was a challenge.
Other key challenges included:
- Determining rates - 19%
- Editing content - 9%
- Filming content - 5%
- Creating a portfolio - 2%
- Time - 2%
Over 93% of UGC creators believed brands needed to ask for permission before sharing their work.
However, 47% of UGC creators had their content used without their permission in 2024. A further 34% admitted that they were not credited as the content creator.
At 30%, the unauthorized use of UGC creators' work was most common on Instagram.
TikTok and YouTube weren’t far behind at 25% and 24%, respectively.
According to 19% of UGC creators, the most common unauthorized reuse of content in 2024 occurred in the Music industry.
This was followed by industries such as
- Food & Beverage - 19%
- Health and beauty - 15%
- Fashion - 11%

65% of brands struggled to gather UGC in 202436.
A further 63% had trouble maintaining a constant supply of fresh content. Getting the rights/licensing to use UGC was cited as an even bigger challenge at 87%.
As per a 2023 study, consumers were concerned about all types of fake UGC37.
- 75% were concerned about fake reviews.
- 69% were concerned about fake images.
- 69% were concerned about fake social media content.
- 68% were concerned about fake videos.
- 66% were concerned about fake Q&As.
63% of consumers expected brands to deal with fake UGC.
Close to 50% believed governmental bodies should be solving issues around fake online content. Meanwhile, 36% expected third-party experts to intervene.
Create and commission UGC with Whop
You already know Whop as the go-to platform for making money online, and that’s still true. But now, there’s another reason to get excited: Whop is also the easiest way to find paid UGC work and run UGC campaigns.
Let’s break it down.
Commissioning UGC as a brand
If you’re a brand looking to tap into UGC, Whop’s Content Rewards feature makes it easy. Just set your budget, outline your content requirements, and choose your payout (based on cost per mille).
Creators will then make content based on your brief and share the links with you. Whop tracks the views and handles the payouts. Yep - it’s really that simple.
Getting paid for UGC as a creator
If you’re a UGC creator, just head to Whop’s Content Rewards, filter by UGC opportunities, and start creating! Make sure you follow the brief and use any provided assets, then upload your content link to submit your work.
The best part? The more views your content gets, the more money you make.
Sources
References
- Collabstr
- Turtl
- Massive
- G2
- Businesswire
- eMarketer
- Inbeat
- PPC
- CreatorLabz
- Exploding Topics
- Neoreach
- Nosto
- Influencer Marketing Hub
- PowerReviews
- Entribe
- Exploding topics
- Bazaarvoice
- Bazaarvoice
- 1worldsync
- PowerReviews
- Bazaarvoice
- Meltwater
- Deloitte
- Statusphere
- Statista
- Taggbox
- eMarketer
- eMarketer
- Influencer Marketing Hub
- Medianug
- Billo
- Statusphere
- UGC101
- Influencer Marketing Report
- Hubspot
- Tintup
- Bazaarvoice